I recently wrote an article showing how to configure Prometheus and Grafana for easy metrics collection. In that article, I assumed that the system which should be monitored would use the systemd approach for defining services.
I now had to set up the node_exporter utility on a system which uses the initd approach. Thus, I provide some simple instructions here on how to accomplish that.
- Go to the directory /opt
- Download the latest version of the node_exporter executable suitable for your system.
wget https://github.com/prometheus/node_exporter/releases/download/v0.15.2/node_exporter-0.15.2.linux-amd64.tar.gz
- Extract the archive
tar xvfz node_exporter-*.tar.gz
- Create a link
ln -s node_exporter-* node_exporter
- Create the file /opt/node_exporter/node_exporter.sh and add the following content:
#!/bin/sh /opt/node_exporter/node_exporter --no-collector.diskstats
- Create the file /etc/init.d/node_exporter and add the following content (based on this sample init.d script):
#!/bin/sh ### BEGIN INIT INFO # Provides: node_exporter # Required-Start: $local_fs $network $named $time $syslog # Required-Stop: $local_fs $network $named $time $syslog # Default-Start: 2 3 4 5 # Default-Stop: 0 1 6 # Description: ### END INIT INFO SCRIPT=/opt/node_exporter/node_exporter.sh RUNAS=root PIDFILE=/var/run/node_exporter.pid LOGFILE=/var/log/node_exporter.log start() { if [ -f "$PIDFILE" ] && kill -0 $(cat "$PIDFILE"); then echo 'Service already running' >&2 return 1 fi echo 'Starting service…' >&2 local CMD="$SCRIPT &> \"$LOGFILE\" && echo \$! > $PIDFILE" su -c "$CMD" $RUNAS > "$LOGFILE" echo 'Service started' >&2 } stop() { if [ ! -f "$PIDFILE" ] || ! kill -0 $(cat "$PIDFILE"); then echo 'Service not running' >&2 return 1 fi echo 'Stopping service' >&2 kill -15 $(cat "$PIDFILE") && rm -f "$PIDFILE" echo 'Service stopped' >&2 } uninstall() { echo -n "Are you really sure you want to uninstall this service? That cannot be undone. [yes|No] " local SURE read SURE if [ "$SURE" = "yes" ]; then stop rm -f "$PIDFILE" echo "Notice: log file is not be removed: '$LOGFILE'" >&2 update-rc.d -f remove rm -fv "$0" fi } case "$1" in start) start ;; stop) stop ;; uninstall) uninstall ;; retart) stop start ;; *) echo "Usage: $0 {start|stop|restart|uninstall}" esac
Note 1: This sample script runs the script as user root. For production environments, it is highly recommended to configure another user (such as ‘prometheus’) which runs the script.
Note 2: Also check out this init.d script made specifically for node_exporter: node.exporter.default by eloo.
- Make both files executable
chmod +x /etc/init.d/node_exporter chmod +x <em>/opt/node_exporter/node_exporter.sh</em>
- Test the script
/etc/init.d/node_exporter start /etc/init.d/node_exporter stop
- Enable start with chkconfig
chkconfig --add node_exporter
All done! Now you can configure your Prometheus server to grab the metrics from the node_exporter instance.
Hi
The script has a strange issue
When you save the pid file it is actually the pid of the process which is starting node_exporter.sh file which will start node export process with the diffrerent pid. And when you are trying to kill the process it will actually kill node_exporter.sh while node_exporter will continue running and listen port 9100
Thank you for your comment!
I think the basic script I used here as a template had a few issues … I have updated the start) method in the code above. Does it work now?
thankyou ! but while running the init.d script , it blocks at Starting service… and when i checked the script with http://www.shellcheck.net is says ‘local’ is undefined ! can you help me.
Thank you for your message! That is strange. I think that error message refers to that ‘local’ is not supported in strict POSIX – but your bash should support it. Does it give any error messages during the startup?
Thanks for this excellent article.
I configured grafana , prometheus and node exporter but in Grafans single server node exporter” it is showing none in server list.
Can you please help me to understand the problem ?
Thanks,
Jafar
Hi Jafar, thank you for your message! Did you solve the problem yet? Could you verify the metrics for the machine are reported? Did you provide the right address for the server in Prometheus?
HI Max,
Yes, problem is solved. It was issue of wrong ip address 🙂
Thanks,
Jafar
Awesome, thanks for the update Jafar!
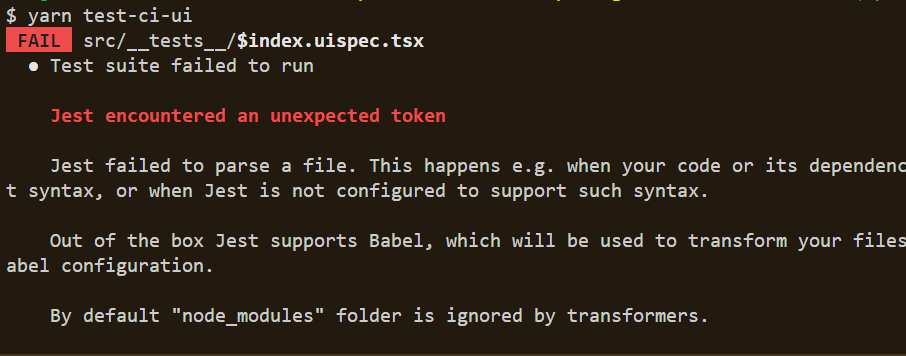
Is this thread still gets updated? when running /etc/init.d/node_exporter start… I’m getting stuck at “Starting Service….”
When I force stopped and checked the node_exporter.log,…I see the below errors.
“level=error ts=2020-03-15T19:33:12.156Z caller=collector.go:161 msg=”collector failed” name=softnet duration_seconds=0.000105656 err=”could not get softnet statistics: failed to parse /proc/net/softnet_stat: 10 columns were detected, but 11 were expected”
Caqn you help me? Thanks.
Thank you for your message! I assume that is an issue with node_exporter rather than the script? Can you start node_exporter by itself? Maybe you could try a different version of node_exporter? Or there might be some incompatibility with your system and node_exporter?
I was able to able to remove the errors now using a workaround given on github.
Adding –no-collector.softnet on /opt/node_exporter/node_exporter.sh.
However when starting up using /etc/init.d/node_exporter start.. it will run by I am stuck on “Starting Service..”
If I close my terminal, the command will force stopped.
I’m trying to monitor Centos 6 by the way.
Thank you iamkiki89! So you are running
`/opt/node_exporter/node_exporter –no-collector.diskstats –no-collector.softnet`?
Are you able to start node_exporter manually? If so, which command works for you?
Thank you for the article.
I created a service account whose shell is “/sbin/nologin”. But it seems fail to start the service by your script. The cause should be the “su” command not working with user whose shell is “/sbin/nologin”. Any idea about this?
Thank you for your comment! Could you try with a different shell?